This page summarizes what public sources say about the state of Lake Atitlán. Where a figure comes from an organization describing its own work, we say so. Where we could not find something out, we say that too.
In short
- The lake has had algae blooms since 2008, and how bad they are varies a lot from year to year.
- Poorly treated sewage, runoff from rivers and farms, soil erosion, nutrients falling from the air, and trash all add to the problem. No one has a reliable split showing how much comes from each.
- The lake authority’s own tests find fecal contamination near towns, including at the lake water intakes used for drinking, and a study of San Pedro’s wells found nitrate above the legal limit in most of them. See “Drinking water and swimming” below.
Algae blooms
Blooms of cyanobacteria (“blue-green algae”) have been recorded since 2008 and 2009. The 2009 bloom, caused by a species called Limnoraphis robusta, covered about 40% of the lake’s surface.1 Another large bloom, of a different type, appeared in 2015.2
The pattern changes from year to year. The lake authority (AMSCLAE) reported no cyanobacteria bloom in 2024.3 In 2025, algae counts were low most of the year, with a rise in cyanobacteria in June that the authority linked to nutrients washed in by the first rains and possibly to dust from the Sahara.4 In late May 2026 the lake was placed on an orange alert, the third of four levels.5,6 AMSCLAE says blooms have occurred every year since 2009 and have become more frequent.5 A quiet year does not mean the problem has gone away. We have not seen an official notice of the alert level after May 2026.
The alert system
AMSCLAE publishes a four-level “cianosemáforo” (cyanobacteria traffic light). At the medium (orange) level, the water is not suitable for drinking or recreation. At the high level, bathing is prohibited and people should not eat fish or shellfish from the lake.7 We do not post the current level here because it changes. Check the authority’s website.8
What the lake’s measurements show
- Clarity. In 2025 the water was clear to a depth of 4 to 11 meters (average 7.6 m). Clarity has declined since the 1960s.4
- Oxygen. Near the surface there is plenty of oxygen. Below about 60 meters there is very little, which the authority ties to the lake being fed too many nutrients.4
- Nutrients. Levels are relatively low, but enough to cause algae blooms. The authority describes nitrogen as the nutrient that limits growth in the surface water.4 We have not yet had a lake scientist explain what that means for solutions, so we do not draw conclusions from it.
Where the nutrients come from
- Sewage. In 2018, AMSCLAE counted 20 densely populated villages with about 193,000 people. About 28% of their wastewater reached a treatment plant, about 46% soaked into the ground through septic tanks and latrines, and about 26% was discharged untreated into rivers or the lake. Only three of the 12 treatment plants even sometimes met the legal standards. These are 2017 data.9
- Rivers and farms. The lake’s two largest rivers, the Quiscab and the San Francisco, carry large nutrient loads. At their peaks they carried about 150 and 203 kilograms of phosphorus a day.3 The authority also lists farm chemicals and eroded soil among the causes.4
- The air. A 2022 study estimated that about 151 tons of nitrogen and 5.6 tons of phosphorus fall onto the lake from the air each year. The authors say the phosphorus is comparable to what the main rivers bring, and the nitrogen about double.10
We could not find a reliable percentage split among these sources, and this site does not invent one.
Trash and plastic
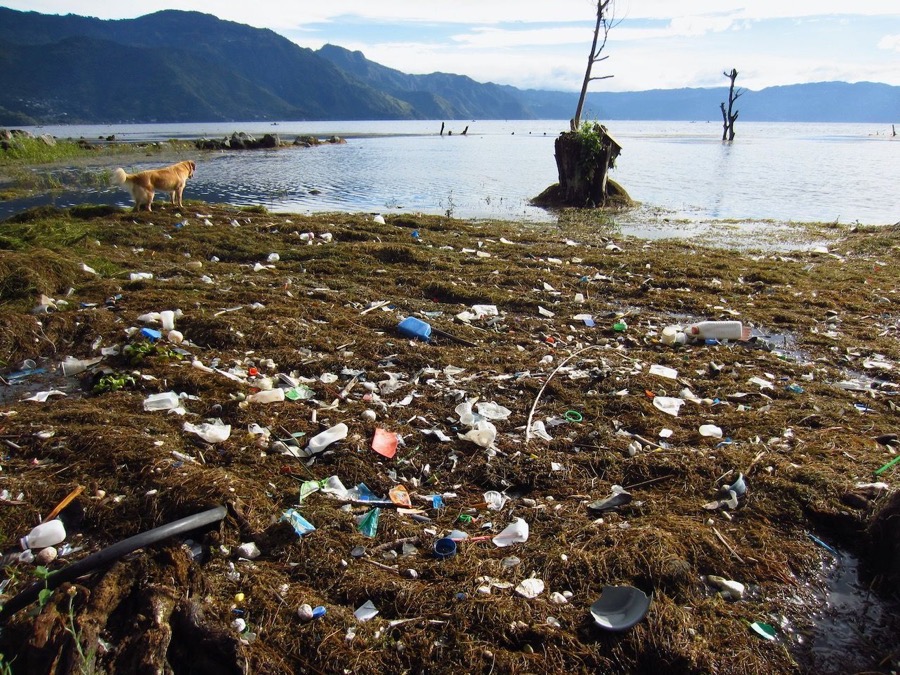
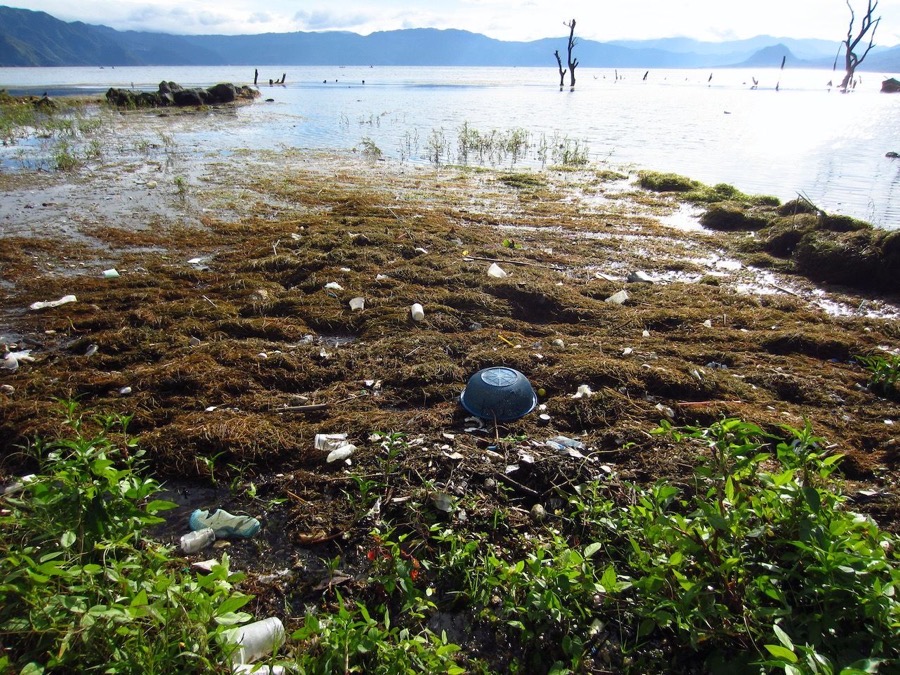
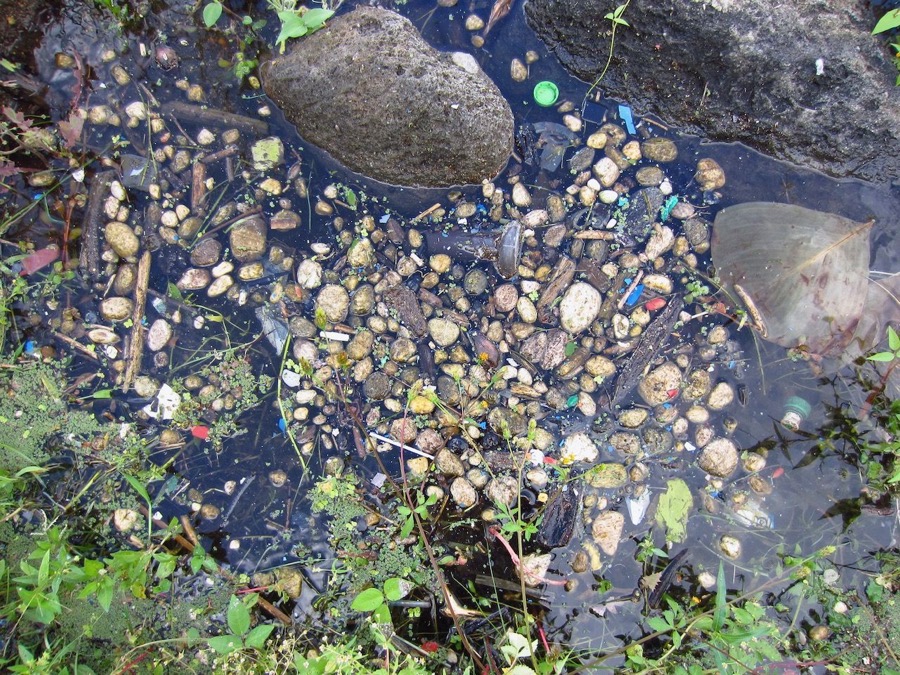
About 3,000 tons of garbage are estimated to enter the lake each rainy season, according to an estimate reported in 2023.11 A 2018 TV news report on a Universidad del Valle study said surface microplastics averaged about 128,763 particles per square kilometer.12 We have not seen the study itself. Local groups’ work on trash is described on the page Who’s Working on It.
Drinking water and swimming
The lake authority tests lake water twice a year, in March (dry season) and September (rainy season). Since 2024 it has sampled 37 points: 11 where towns draw lake water for drinking (San Lucas Tolimán, Santiago Atitlán and San Pedro La Laguna), 10 near towns, and 16 beaches.13
- In 2025, every one of the 11 drinking-water intakes showed contamination. Some had no E. coli, but all had coliform bacteria. The authority’s conclusion is that lake water is not fit for drinking without treatment.13
- All samples taken near towns showed high fecal contamination. Most beaches were contaminated, except Playa Dorada in San Pedro La Laguna and Chicamán in San Antonio Palopó.13
- Limits of these results: one sample per site per visit, one year, and Guatemala has no legal standard for recreational water, so the authority used the drinking-water standard as a reference.13
- A news report on Ministry of Environment inspections gives larger figures: 77% of drinking-water sources and 81% of beaches affected.14 We have not seen the Ministry’s own data.
Algae toxins
When cyanobacteria bloom, contact with the water can irritate skin and cause eye and ear infections.5 At lower alert levels, the lake authority advises rinsing with clean water after contact; at higher levels, no bathing.7
Well water
San Pedro’s water comes from hand-dug wells, mechanical wells, a spring and the lake, and the town disposes of wastewater by letting it soak into the ground, according to a 2018 study.15 (Another source says San Pedro discharges directly into the lake. We could not confirm which is accurate.14)
- Researchers sampled all ten wells they could find, in the rainy season (September 2015) and the dry season (February 2016). In the dry season, seven wells were above the national limit of 50 mg/L of nitrate, with readings between 65 and 506 mg/L. One well near coffee farms had very high ammonia. The author says these levels can cause health problems in children.15
- A second paper rated the aquifer’s vulnerability as moderate to extreme in parts of San Pedro and said there was no initiative to protect aquifers in San Pedro or the basin.16
- These data are about ten years old and come from ten wells. They may have changed. We found no newer measurements.
Practical steps for households are on the page What You Can Do.
What we don’t know
- How much each source contributes.
- Current figures for San Pedro’s own sewage; sources disagree on whether it goes mostly into the ground or into the lake (see “Well water” above).
- Whether San Pedro’s public water supply is treated, and how, and current well measurements.
- The alert level after May 2026.
About this page
This page was compiled from public sources in October 2026. It has not yet been reviewed by people in San Pedro,. If you know something we have missed or got wrong, such as a correction, a local study, a group’s work or your own experience, please send it to contact@sanpedrolalaguna.earth. We will read it and add or correct what we can confirm.
Sources
- Flores-Anderson, A. et al., satellite algorithm for chlorophyll in Lake Atitlán, Frontiers in Environmental Science, 2020. Peer-reviewed. Link
- “Lake Atitlán,” Wikipedia (for the 2015 bloom). An encyclopedia, so a secondary source. Link
- AMSCLAE, annual monitoring report 2024 (the lake authority’s own report). Link
- AMSCLAE, “Informe monitoreo limnológico 2025,” December 2025 (the lake authority’s own report). Link
- Prensa Libre (Guatemala’s largest daily), report on the orange cyanobacteria alert, May 28, 2026. Link
- La Hora (Guatemalan daily), “Lago Atitlán se encuentra en alerta naranja por florecimiento de cianobacterias,” May 26, 2026. Link
- Agencia Guatemalteca de Noticias (government news agency), “¿Conoce el cianosemáforo vigente en el lago de Atitlán?” November 25, 2024. Link
- AMSCLAE (Autoridad para el Manejo Sustentable de la Cuenca del Lago de Atitlán y su Entorno), official website. Link
- AMSCLAE, “Estrategia de intervención para el manejo de las aguas residuales en la cuenca del Lago de Atitlán,” 2018 (the lake authority’s own strategy; figures are from 2017 data). Link
- Dix, M. et al., “Ingreso de nitrógeno y fósforo al lago Atitlán (Guatemala) vía deposición atmosférica,” 2022. Peer-reviewed (we read the abstract). Link
- The Progressive, “Guatemala’s Rivers of Garbage,” August 16, 2023. Established US magazine; the figure is an attributed estimate. Link
- Guatevisión (TV news), report on a 2018 Universidad del Valle microplastics study, July 2018. We have not seen the study itself. Link
- AMSCLAE, “Monitoreo de salubridad 2025” (the lake authority’s own annual report). Link
- Agencia Ocote, “Municipalidades de la cuenca del lago Atitlán son sancionadas por contaminación,” October 10, 2025. Independent investigative outlet. Link
- Rodríguez Juárez, E., “Nitrógeno en las aguas subterráneas del municipio de San Pedro La Laguna, Sololá,” Agua, Saneamiento & Ambiente (Universidad de San Carlos), 2018. Peer-reviewed; samples from 2015 to 2016. Link
- Escobar López, H., “Evaluación del riesgo de contaminación de las aguas subterráneas del municipio de San Pedro La Laguna, Sololá,” Agua, Saneamiento & Ambiente, 2020. Peer-reviewed. Link